
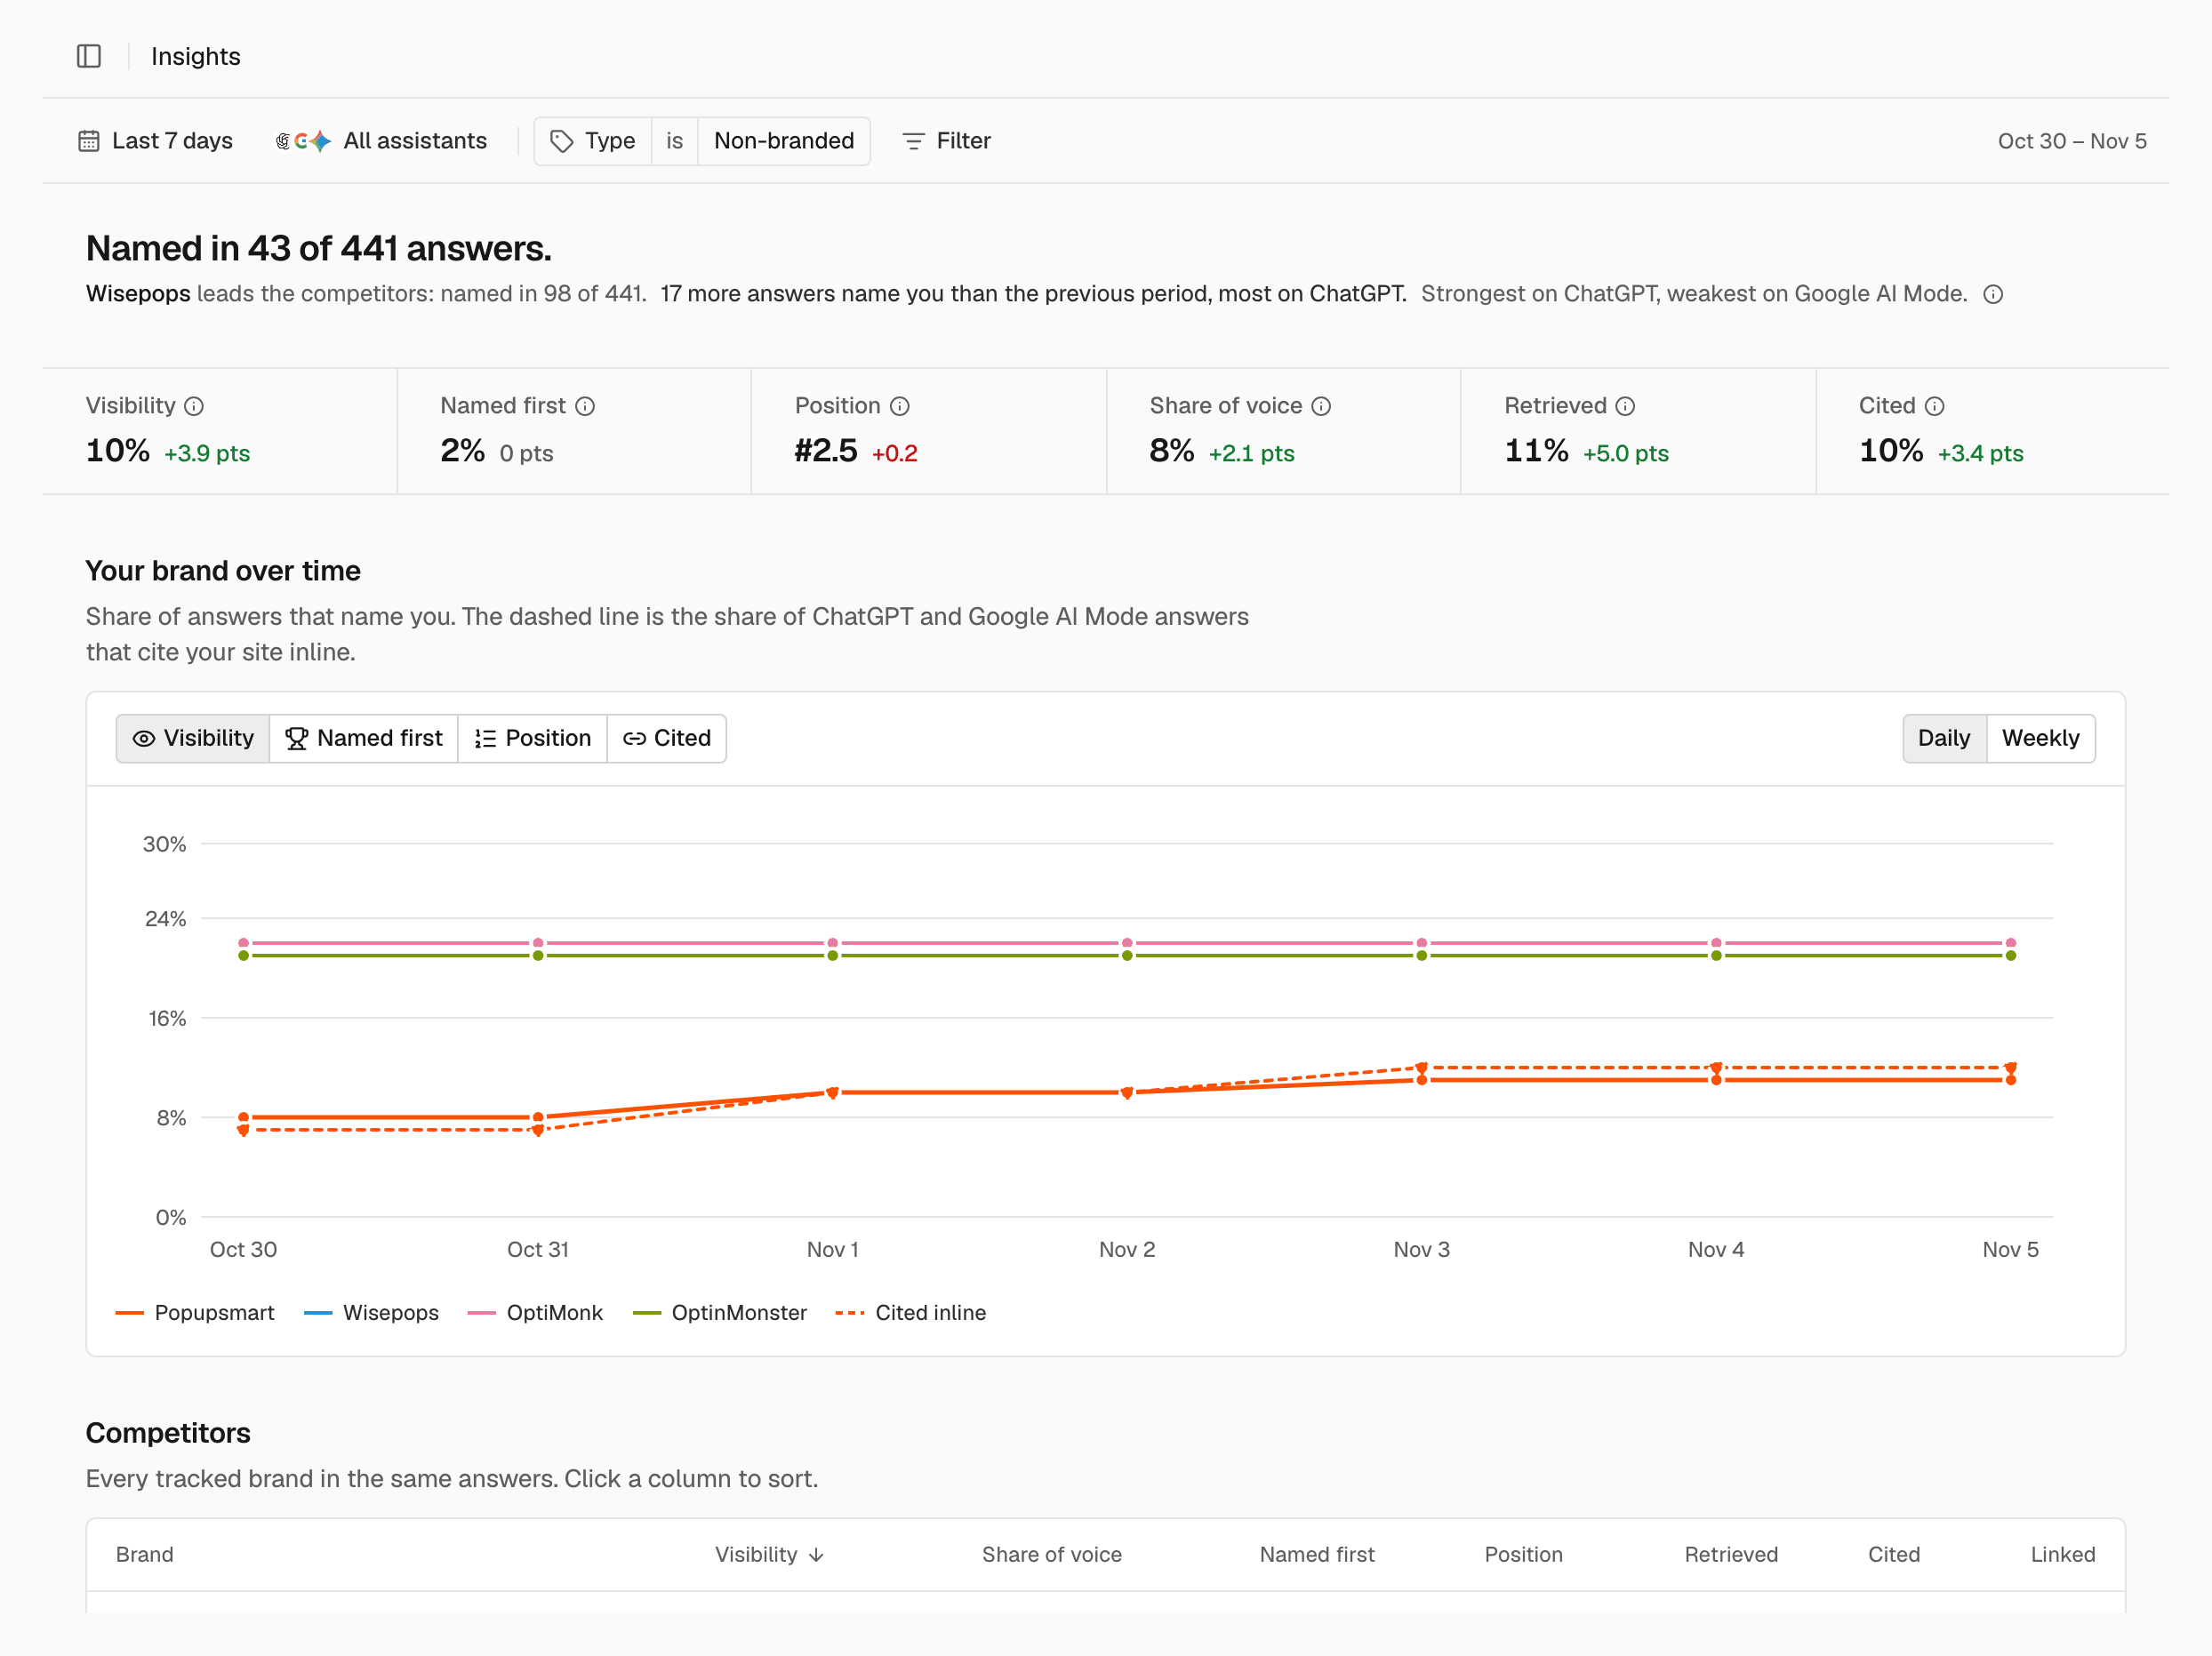
The headline
The first line tells you how many answers name your brand, for example Named in 42 of 378 answers. After it you see:- The competitor named most often, and in how many answers.
- How many more or fewer answers name you than in the previous period, and the assistant where the change was largest.
- The assistant where you are strongest and the one where you are weakest.
Metric tiles
Each tile shows your brand’s value for the period: Visibility, Named first, Position, Share of voice, Retrieved and Cited. Hover the info icon next to a tile name for its definition. When Compare to previous period is on, a change shows next to the value. What each tile means: Metrics. How changes are counted, and why one can’t be computed: Metrics.Your brand over time
The chart has one line for your brand and one for each of your three most visible competitors.- Choose the metric in the chart header: Visibility, Named first, Position or Cited.
- Switch between Daily and Weekly in the chart header.
- Hover a day to read each brand’s value and the number of answers behind it.
- A dashed vertical line marks a day when something changed that can move the numbers: prompts added or archived, or an assistant’s model changed. Hover that day to see what happened.
Competitors
The Competitors table lists every tracked brand in the same answers, with your brand highlighted. Click a column name to sort by it. The columns are Visibility, Share of voice, Named first, Position, Retrieved, Cited and Linked, measured for each brand. See Metrics for their definitions. To add or remove the brands you track, see Competitors.By topic
By topic shows you and the most named competitors in each topic. Switch the cells between Visibility, Share of voice and Position. The stronger the cell, the deeper its shade.Rankings by assistant
Rankings by assistant shows the tracked brands for each assistant, ordered by how many answers name them.Related
Metrics
What each tile and column means.
Filter reports
Change the period, assistants and prompts.
Answers
Read the answers behind a number.
Competitors
Choose the brands you compare with.